Stock · HYUNDAI · Automobiles
HYUNDAI share price target 2026
Support, resistance, the F&O structure and the BazaarBaazi Crack Score for Hyundai Motor India Ltd, refreshed every end-of-day run. A systematic, data-only read on Hyundai Motor India Ltd: where it trades versus its 50-day and 200-day lines, the live 52-week range, and momentum. Refreshed from real price structure each run.
The verdict
BazaarBaazi reads HYUNDAI as two-way with a Crack Score of 52/100 as of 30 Jun 2026.
BazaarBaaziSource & method
Price target: support and resistanceComputed 30 Jun 2026
Support and resistance for HYUNDAI are read inside the latest show; no spot was printed in the most recent editorial note.
Levels are read inside the latest show. The most recent editorial reference is Systematic Read on 9 Jun 2026.
These are structural reference lines, not a SEBI-registered price target. BazaarBaazi is independent media; the levels frame how the desk reads the HYUNDAI chart, refreshed every end-of-day run.
The Crack Score, and how it is built52 / 100 · Range / mixed
The Crack Score is a deterministic 0 to 100 conviction number. Here is exactly what moved it for HYUNDAI, so the figure is a transparent signal rather than a vibe.
Base 50, adjusted by the factors above and clamped to 0 to 100. How the Crack Score works.
The F&O viewHorizon · swing
How the futures and options structure on HYUNDAI reads right now.
The futures and options read on HYUNDAI leans to a two-way / range write. Strike-level positioning is read inside the latest show, against the printed spot. Single-stock F&O on HYUNDAI is thinner than the index, so open-interest shifts read with more noise; the desk weights price structure over raw OI. This is a structural reading of positioning, not a derivatives trade recommendation.
Why it movedLatest editorial line
The most recent BazaarBaazi read on what is driving HYUNDAI.
Systematic read: a disclosed, data-only model on real 1-year price structure.
Read in Systematic Read on 9 Jun 2026. Why HYUNDAI moved, the living explainer, tracks every move on one URL.
Latest filed resultsQ4 FY26
Hyundai Motor India Ltd's most recent quarter, parsed straight from the official NSE filing. Every figure links back to its primary source.
Result Pulse
38 / 100Revenue
Rs 18,916 crNet profit
Rs 1,256 crEPS (quarter)
Rs 15.45| Growth | YoY | QoQ |
|---|---|---|
| Revenue | +5.4% | +5.2% |
| Net profit | -22.2% | +1.7% |
| Net margin | +6.6% | |
Figures are the Q4 FY26 result for Hyundai Motor India Limited, parsed straight from the official NSE integrated filing and verified to the paisa. The EPS shown is for the quarter, not a trailing-twelve-month figure, so it is not a P/E input.
Earnings historyLast 7 quarters
Hyundai Motor India Ltd's official quarterly revenue, EPS and Result Pulse trail from the verified filings export. These are quarterly facts, not TTM valuation inputs.
HYUNDAI official result trail
7 quarters
Quarterly figures only: revenue, net profit and EPS are copied from official filings. EPS here is not trailing twelve month EPS and is not used for valuation.
| Quarter | Revenue | EPS | PAT YoY | Pulse | Source |
|---|---|---|---|---|---|
| Q4 FY26ended 31 Mar 2026 / Consolidated, audited | Rs 18,916 cr | Rs 15.45 | n/a | n/a | Filing |
| Q3 FY26ended 31 Dec 2025 / Consolidated, audited | Rs 17,973 cr | Rs 15.19 | n/a | 44/100 | Filing |
| Q2 FY26ended 30 Sep 2025 / Consolidated, audited | Rs 17,461 cr | Rs 19.35 | n/a | n/a | Filing |
| Q1 FY26ended 30 Jun 2025 / Consolidated, audited | Rs 16,413 cr | Rs 16.85 | n/a | 50/100 | Filing |
| Q4 FY25ended 31 Mar 2025 / Consolidated, audited | Rs 17,940 cr | Rs 19.87 | n/a | 50/100 | Filing |
| Q3 FY25ended 31 Dec 2024 / Consolidated, audited | Rs 16,648 cr | Rs 14.29 | n/a | n/a | Filing |
| Q2 FY25ended 30 Sep 2024 / Consolidated, audited | Rs 17,260 cr | Rs 16.93 | n/a | n/a | Filing |
Key fundamentalsEditorial reference
The anchor data BazaarBaazi references when reading the HYUNDAI chart. Not a substitute for a registered research note.
| Ticker | HYUNDAI |
|---|---|
| Full name | Hyundai Motor India Ltd |
| Sector | Automobiles |
| Index class | LARGE CAP |
| ISIN | INE0V6F01027 |
| Market-cap band | ~1.5 lakh cr |
| Last referenced level | Inside latest show |
| Last session move | Not referenced this cycle |
| Editorial line in | Systematic Read on 9 Jun 2026 |
| Aliases tracked | HYUNDAI |
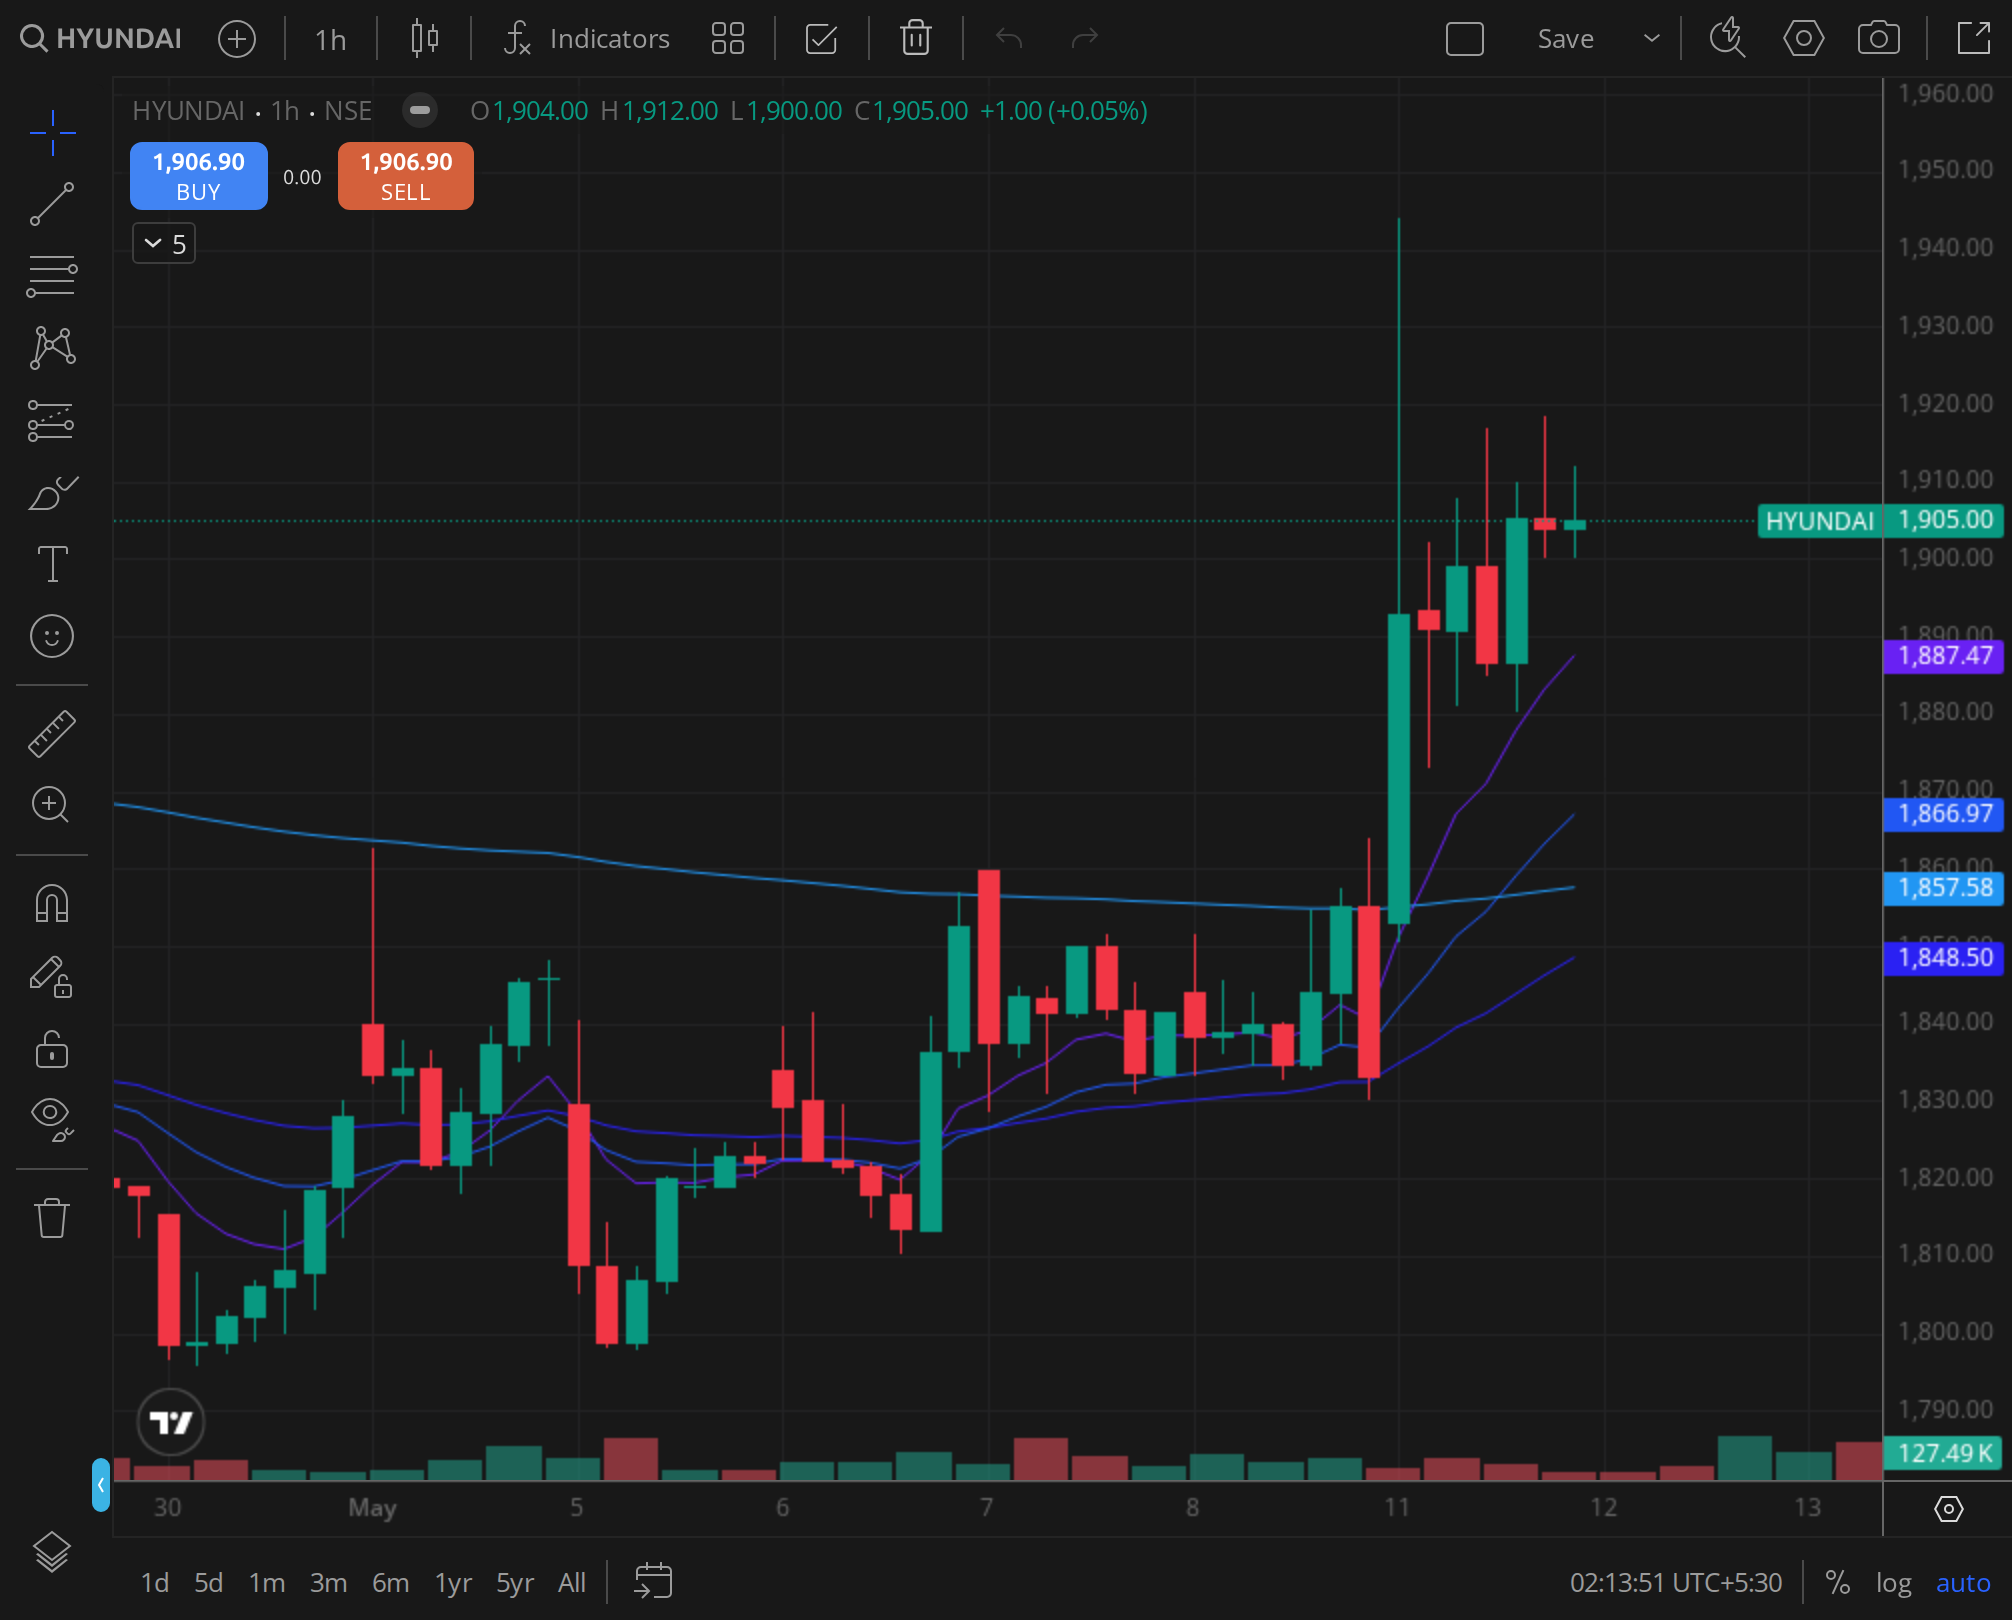
Reference chart22 Oct 2024
The daily frame the desk reads on HYUNDAI.
FAQ8 reader questions · AEO-eligible
The line on HYUNDAI, distilled and schema-marked for AI Overview, Perplexity, and reader search.
What is the HYUNDAI share price target for 2026?
BazaarBaazi does not publish a SEBI-registered price target on HYUNDAI. The desk reads structural support and resistance inside each show against the printed spot; the most recent editorial line is Systematic Read on 9 Jun 2026.
What is BazaarBaazi's Crack Score for HYUNDAI?
The BazaarBaazi Crack Score for HYUNDAI is 52 out of 100 as of 30 Jun 2026, a range / mixed reading. It is a computed conviction number from the signed stance, how consistent the recent verdicts have been, the quality of the printed structure, and how fresh the review is. It is a transparency signal, not investment advice.
What is the F&O view on HYUNDAI?
As of 30 Jun 2026, BazaarBaazi reads HYUNDAI positioning as a two-way range write. This is a structural reading of the option chain, not a derivatives recommendation.
What sector is HYUNDAI in and which peers does BazaarBaazi track?
HYUNDAI sits in Automobiles (large cap), indicative market cap ~1.5 lakh cr, ISIN INE0V6F01027. The peers BazaarBaazi reads alongside it are Mahindra & Mahindra Limited, Bajaj Auto Limited, Eicher Motors Limited. A systematic, data-only read on Hyundai Motor India Ltd: where it trades versus its 50-day and 200-day lines, the live 52-week range, and momentum. Refreshed from real price structure each run.
How often is the HYUNDAI view updated?
This page is one evergreen URL refreshed in place. The Crack Score and levels re-compute on every BazaarBaazi end-of-day run, and the dated stamp shows the last refresh. The latest signed verdict on HYUNDAI is mixed, published in Systematic Read on 9 Jun 2026.
What was Hyundai Motor India Limited's Q4 FY26 net profit?
Hyundai Motor India Limited reported a net profit of Rs 1,256 cr for Q4 FY26 (the quarter ended 31 March 2026). That is -22.2% year on year. The figure is from the company's official NSE filing.
What was Hyundai Motor India Limited's Q4 FY26 revenue?
Hyundai Motor India Limited reported revenue of Rs 18,916 cr for Q4 FY26. That is +5.4% year on year. The figure is from the company's official NSE filing.
How does BazaarBaazi rate Hyundai Motor India Limited's Q4 FY26 result?
BazaarBaazi gives Hyundai Motor India Limited's Q4 FY26 result a Result Pulse of 38 out of 100, with a verdict of Mixed. The Result Pulse is a BazaarBaazi editorial score for the quality of the filed result, not investment advice.
Related stock views
The names BazaarBaazi reads alongside HYUNDAI, each a living view refreshed every end-of-day run.