Stock · DRREDDY · Pharmaceuticals
DRREDDY share price target 2026
Support, resistance, the F&O structure and the BazaarBaazi Crack Score for Dr. Reddy's Laboratories Limited, refreshed every end-of-day run. A systematic, data-only read on Dr. Reddy's Laboratories Limited: where it trades versus its 50-day and 200-day lines, the live 52-week range, and momentum. Refreshed from real price structure each run.
The verdict
BazaarBaazi reads DRREDDY as two-way with a Crack Score of 57/100 as of 30 Jun 2026.
BazaarBaaziSource & method
Price target: support and resistanceComputed 30 Jun 2026
Support and resistance for DRREDDY are read inside the latest show; no spot was printed in the most recent editorial note.
Levels are read inside the latest show. The most recent editorial reference is Systematic Read on 9 Jun 2026.
These are structural reference lines, not a SEBI-registered price target. BazaarBaazi is independent media; the levels frame how the desk reads the DRREDDY chart, refreshed every end-of-day run.
The Crack Score, and how it is built57 / 100 · Constructive
The Crack Score is a deterministic 0 to 100 conviction number. Here is exactly what moved it for DRREDDY, so the figure is a transparent signal rather than a vibe.
Base 50, adjusted by the factors above and clamped to 0 to 100. How the Crack Score works.
About Dr. Reddy's Laboratories LimitedBusiness profile
What DRREDDY actually does, and the edge that holds its position.
Dr Reddys is the most geographically spread of the big Indian generics names, and that diversification is both its defence against any single market and the source of its odd Russia exposure. It operates across North America, Europe, Russia and the CIS, and India, making and selling branded generics, active pharmaceutical ingredients, biosimilars and proprietary drugs. The Russia and CIS business is a historically important revenue stream alongside US generics, and a growing biosimilars portfolio spans emerging and regulated markets, so the spread that cushions it also ties it to a geopolitically volatile geography peers largely avoid.
Dr Reddys has an integrated API-to-formulation capability that gives it cost control and supply assurance across molecules, which is a structural advantage during global supply-chain disruptions. Its presence across multiple geographies and therapy categories means it is less exposed to any single market cycle than single-geography generic peers.
The F&O viewHorizon · swing
How the futures and options structure on DRREDDY reads right now.
The futures and options read on DRREDDY leans to a two-way / range write. Strike-level positioning is read inside the latest show, against the printed spot. Single-stock F&O on DRREDDY is thinner than the index, so open-interest shifts read with more noise; the desk weights price structure over raw OI. This is a structural reading of positioning, not a derivatives trade recommendation.
Why it movedLatest editorial line
The most recent BazaarBaazi read on what is driving DRREDDY.
Systematic read: a disclosed, data-only model on real 1-year price structure.
Read in Systematic Read on 9 Jun 2026. Why DRREDDY moved, the living explainer, tracks every move on one URL.
The 2026 to 2030 pictureStructural read
What genuinely drives DRREDDY over a multi-year horizon. A structural read, not a price forecast.
Between 2026 and 2030, the drivers for Dr Reddys are US market new product launches reducing dependency on a small set of molecules, biosimilars scaling in the US and Europe, and the Russia-CIS business navigating a complex geopolitical environment. The key risks are USFDA action at any manufacturing facility and geopolitical disruption to the Russia business that has historically been a meaningful earnings contributor. What BazaarBaazi thinks: the multi-geography spread and API-to-formulation integration are genuine structural strengths, but the wildcard no score can model is Russia, a meaningful earnings contributor sitting in a geography where a sanction or currency move can swing the line in ways no fundamental read anticipates.
What to watch:
- US new product launches per year and the pipeline of pending ANDAs
- USFDA inspection outcomes for API and formulation facilities
- Russia and CIS business revenue trend given geopolitical volatility
- Biosimilar approvals and commercial launch timelines in US and European markets
- API segment revenue as an indicator of vertical integration leverage
Peers and how to compare5 listed names
The listed names DRREDDY is most often read against. Compare them on the same Crack Score and levels.
Sun Pharmaceutical Industries · SUNPHARMA
Read the SUNPHARMA verdict and levels
Cipla · CIPLA
Read the CIPLA verdict and levels
Divis Laboratories · DIVISLAB
Read the DIVISLAB verdict and levels
Lupin
Listed peer in the same space
Aurobindo Pharma
Listed peer in the same space
Live valuation readQ4 FY26 earnings · live spot
P/E, P/B, yield and the quality set for Dr. Reddy's Laboratories Limited, computed from the latest filed results times the live spot. The price-driven ratios (marked) refresh every session; ROE and margins hold until the next results.
P / E
26.4x
Earnings yield
3.79%
P / B
3.00x
P / S
3.36x
EV / EBITDA
16.4x
Dividend yield
0.59%
Market cap
Rs 1.13 lakh cr
Enterprise value
Rs 1.12 lakh cr
Stored from Dr. Reddy's Laboratories Limited's filed results, as of 2026-06-30 and currency-checked. Price input Rs 1,357.10 from baked EOD spot. Open the calculator, move the price and watch every ratio react.
Latest filed resultsQ4 FY26
Dr. Reddy's Laboratories Limited's most recent quarter, parsed straight from the official NSE filing. Every figure links back to its primary source.
Result Pulse
11 / 100Revenue
Rs 7,546 crNet profit
Rs 221 crEPS (quarter)
Rs 2.65| Growth | YoY | QoQ |
|---|---|---|
| Revenue | -11.5% | -13.8% |
| Net profit | -86.0% | -81.4% |
| Net margin | +2.9% | |
Figures are the Q4 FY26 result for Dr. Reddy's Laboratories Limited, parsed straight from the official NSE integrated filing and verified to the paisa. The EPS shown is for the quarter, not a trailing-twelve-month figure, so it is not a P/E input.
Earnings historyLast 8 quarters
Dr. Reddy's Laboratories Limited's official quarterly revenue, EPS and Result Pulse trail from the verified filings export. These are quarterly facts, not TTM valuation inputs.
DRREDDY official result trail
8 quarters
Quarterly figures only: revenue, net profit and EPS are copied from official filings. EPS here is not trailing twelve month EPS and is not used for valuation.
| Quarter | Revenue | EPS | PAT YoY | Pulse | Source |
|---|---|---|---|---|---|
| Q4 FY26ended 31 Mar 2026 / Consolidated, audited | Rs 7,546 cr | Rs 2.65 | -86.0% | 11/100 | Filing |
| Q3 FY26ended 31 Dec 2025 / Consolidated, audited | Rs 8,753 cr | Rs 14.53 | n/a | 44/100 | Filing |
| Q2 FY26ended 30 Sep 2025 / Consolidated, audited | Rs 8,828 cr | Rs 16.18 | n/a | 58/100 | Filing |
| Q1 FY26ended 30 Jun 2025 / Consolidated, audited | Rs 8,572 cr | Rs 17.04 | n/a | 58/100 | Filing |
| Q4 FY25ended 31 Mar 2025 / Consolidated, audited | Rs 8,528 cr | Rs 19.12 | n/a | n/a | Filing |
| Q3 FY25ended 31 Dec 2024 / Consolidated, audited | Rs 8,381 cr | Rs 16.97 | n/a | n/a | Filing |
| Q2 FY25ended 30 Sep 2024 / Consolidated, audited | Rs 8,038 cr | Rs 15.08 | n/a | n/a | Filing |
| Q1 FY25ended 30 Jun 2024 / Consolidated, audited | Rs 7,696 cr | Rs 83.61 | n/a | n/a | Filing |
What changed50 disclosures
Every recent official filing from Dr. Reddy's Laboratories Limited, straight from the exchange feed, with the BazaarBaazi Event Heat on the disclosure flow.
Dr. Reddy's Laboratories Limited has filed 50 official disclosures recently. The most recent is a Press release dated 25 Jun 2026.
Event Heat
63 / 100the Trading Window closure pursuant to SEBI (Prohibition of Insider Trading) Regulations, 2015
Newspaper advertisement titled Notice of the 42nd Annual General Meeting to be held through video conference, record date and final dividend information
a press release dated Jun 13, 2026, titled "Dr. Reddy s announces the first-to-market launch of Bosutinib Tablets 400mg, a generic equivalent of Bosulif®, in the United States.
Kallam Satish Reddy has Submitted to the Exchange a copy of Disclosure under Regulation 31(4) of the Securities and Exchange Board of India (Substantial Acquisition of Shares and Takeovers) Regulations, 2011.
Event Heat is a dated net read of Dr. Reddy's Laboratories Limited's last 90 days of official disclosures, balancing the constructive filings against the ones to watch. It is a signal from what the company has filed, not investment advice. Every line above links to its official exchange filing, and the full market desk is at the disclosures hub.
Key fundamentalsEditorial reference
The anchor data BazaarBaazi references when reading the DRREDDY chart. Not a substitute for a registered research note.
| Ticker | DRREDDY |
|---|---|
| Full name | Dr. Reddy's Laboratories Limited |
| Sector | Pharmaceuticals |
| Index class | LARGE CAP |
| ISIN | INE089A01031 |
| Market-cap band | ~1.1 lakh cr |
| Last referenced level | Inside latest show |
| Last session move | Not referenced this cycle |
| Editorial line in | Systematic Read on 9 Jun 2026 |
| Aliases tracked | DRREDDY |
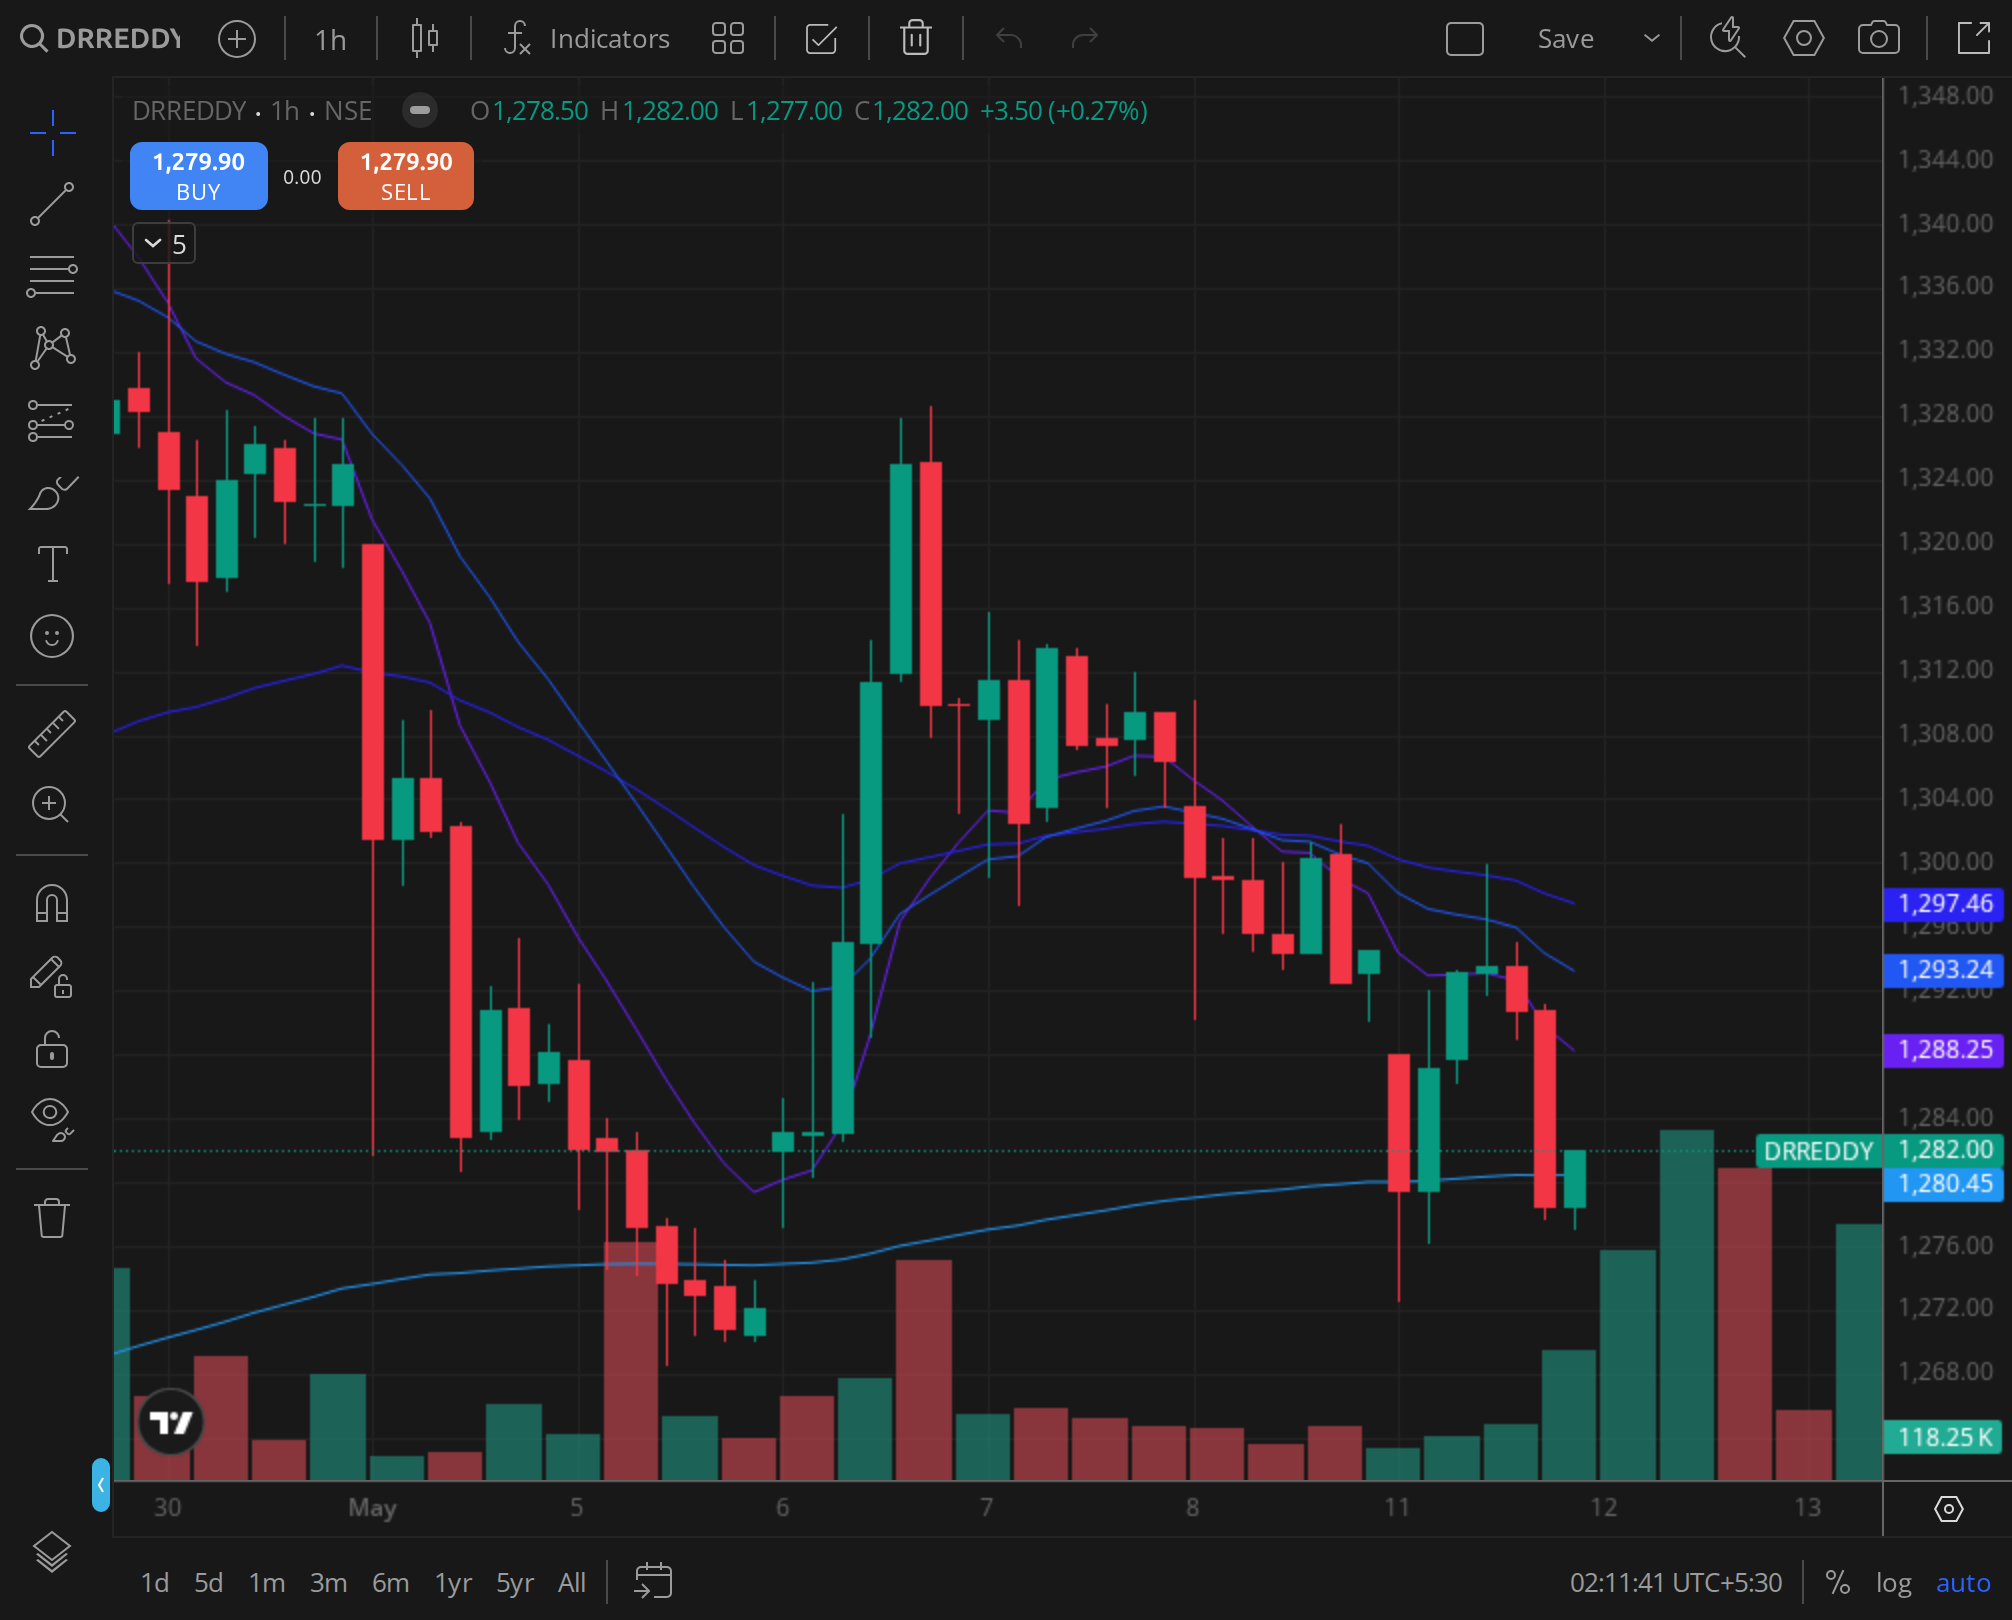
Reference chart7 Oct 2025
The daily frame the desk reads on DRREDDY.
FAQ13 reader questions · AEO-eligible
The line on DRREDDY, distilled and schema-marked for AI Overview, Perplexity, and reader search.
What is the DRREDDY share price target for 2026?
BazaarBaazi does not publish a SEBI-registered price target on DRREDDY. The desk reads structural support and resistance inside each show against the printed spot; the most recent editorial line is Systematic Read on 9 Jun 2026.
What is BazaarBaazi's Crack Score for DRREDDY?
The BazaarBaazi Crack Score for DRREDDY is 57 out of 100 as of 30 Jun 2026, a constructive reading. It is a computed conviction number from the signed stance, how consistent the recent verdicts have been, the quality of the printed structure, and how fresh the review is. It is a transparency signal, not investment advice.
What is the F&O view on DRREDDY?
As of 30 Jun 2026, BazaarBaazi reads DRREDDY positioning as a two-way range write. This is a structural reading of the option chain, not a derivatives recommendation.
What sector is DRREDDY in and which peers does BazaarBaazi track?
DRREDDY sits in Pharmaceuticals (large cap), indicative market cap ~1.1 lakh cr, ISIN INE089A01031. The peers BazaarBaazi reads alongside it are Sun Pharmaceutical Industries Limited, Cipla Limited, Divi's Laboratories Limited. A systematic, data-only read on Dr. Reddy's Laboratories Limited: where it trades versus its 50-day and 200-day lines, the live 52-week range, and momentum. Refreshed from real price structure each run.
How often is the DRREDDY view updated?
This page is one evergreen URL refreshed in place. The Crack Score and levels re-compute on every BazaarBaazi end-of-day run, and the dated stamp shows the last refresh. The latest signed verdict on DRREDDY is mixed, published in Systematic Read on 9 Jun 2026.
Is Dr Reddys a good long-term stock?
Dr Reddys offers geographic diversification and vertical integration most Indian pharma peers lack, but the risk no score captures is its outsized Russia-CIS exposure, where geopolitics rather than execution can drive the earnings line. BazaarBaazi's Crack Score for DRREDDY gives the current dated structural read. The long-term view depends on US pipeline execution and Russia-CIS risk materialising or abating.
Dr Reddys share price target 2030?
What would drive DRREDDY through 2030 is US biosimilars gaining traction and a thick ANDA pipeline converting to launches, the swing factor being Russia-CIS stability that no target can underwrite. BazaarBaazi does not publish fixed multi-year targets. The live Crack Score has the structural setup.
Why is Dr Reddys share falling?
Pressure on DRREDDY usually starts with the triggers the desk watches first, a USFDA import alert or Russia-CIS revenue disruption, with US generics pricing erosion or pipeline approval delays adding to it. The Crack Score levels show the technical picture.
What was Dr. Reddy's Laboratories Limited's Q4 FY26 net profit?
Dr. Reddy's Laboratories Limited reported a net profit of Rs 221 cr for Q4 FY26 (the quarter ended 31 March 2026). That is -86.0% year on year. The figure is from the company's official NSE filing.
What was Dr. Reddy's Laboratories Limited's Q4 FY26 revenue?
Dr. Reddy's Laboratories Limited reported revenue of Rs 7,546 cr for Q4 FY26. That is -11.5% year on year. The figure is from the company's official NSE filing.
How does BazaarBaazi rate Dr. Reddy's Laboratories Limited's Q4 FY26 result?
BazaarBaazi gives Dr. Reddy's Laboratories Limited's Q4 FY26 result a Result Pulse of 11 out of 100, with a verdict of Weak. The Result Pulse is a BazaarBaazi editorial score for the quality of the filed result, not investment advice.
What has Dr. Reddy's Laboratories Ltd announced recently?
Dr. Reddy's Laboratories Ltd's two most material recent disclosures are a press release dated 25 Jun 2026, "General Updates", and an insider trade dated 22 Jun 2026, "the Trading Window closure pursuant to SEBI (Prohibition…". Both link to the company's own official filing on the BazaarBaazi stock page.
Has Dr. Reddy's Laboratories Ltd declared a dividend recently?
Yes. Dr. Reddy's Laboratories Ltd filed a dividend disclosure on 20 Jun 2026, filed as "Newspaper advertisement titled Notice of the 42nd Annual General…". Any amount shown is the exchange's own record, linked from the BazaarBaazi stock page. A dividend is a declared payout, not a forecast of future returns.
Related stock views
The names BazaarBaazi reads alongside DRREDDY, each a living view refreshed every end-of-day run.
Hub
All stock views
The full BazaarBaazi coverage universe, scored and dated.
Pharmaceuticals
SUNPHARMA
Sun Pharmaceutical Industries Limited
Pharmaceuticals
CIPLA
Cipla Limited
Pharma APIs and CDMO
DIVISLAB
Divi's Laboratories Limited
Pharmaceuticals
TORNTPHARM
Torrent Pharmaceuticals Limited
Pharmaceuticals
ZYDUSLIFE
Zydus Lifesciences Limited